Implementation & data collection
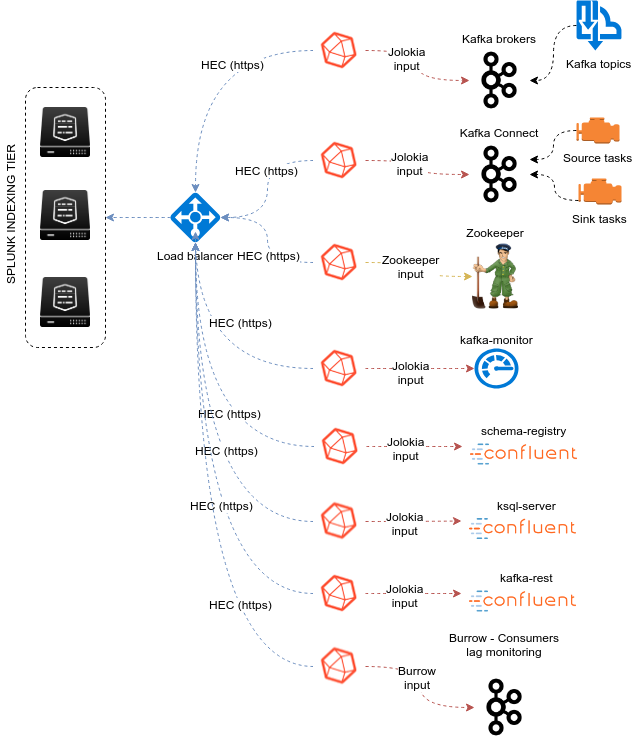
Data collection diagram overview:
Splunk configuration
Index definition
The application relies by default on the creation of a metrics index called “telegraf_kafka”:
indexes.conf example with no Splunk volume::
[telegraf_kafka]
coldPath = $SPLUNK_DB/telegraf_kafka/colddb
datatype = metric
homePath = $SPLUNK_DB/telegraf_kafka/db
thawedPath = $SPLUNK_DB/telegraf_kafka/thaweddb
indexes.conf example with Splunk volumes::
[telegraf_kafka]
coldPath = volume:cold/telegraf_kafka/colddb
datatype = metric
homePath = volume:primary/telegraf_kafka/db
thawedPath = $SPLUNK_DB/telegraf_kafka/thaweddb
In a Splunk distributed configuration (cluster of indexers), this configuration stands on the cluster master node.
All Splunk searches included in the added refer to the utilisation of a macro called “telegraf_kafka_index” configured in:
- telegraf-kafka/default/macros.conf
If you wish to use a different index model, this macro shall be customized to override the default model.
HEC input ingestion and definition
The default recommended way of ingesting the Kafka metrics is using the HTTP Events Collector method which requires the creation of an HEC input.
inputs.conf example:
[http://telegraf_kafka_monitoring]
disabled = 0
index = telegraf_kafka
token = 205d43f1-2a31-4e60-a8b3-327eda49944a
If you create the HEC input via Splunk Web interface, it is not required to select an explicit value for source and sourcetype.
The HEC input will be ideally relying on a load balancer to provides resiliency and load balancing across your HEC input nodes.
Other ingesting methods
There are other methods possible to ingest the Kafka metrics in Splunk:
- TCP input (graphite format with tags support)
- KAFKA ingestion (Kafka destination from Telegraf in graphite format with tags support, and Splunk connect for Kafka)
- File monitoring with standard Splunk input monitors (file output plugin from Telegraf)
Notes: In the very specific context of monitoring Kafka, it is not a good design to use Kafka as the ingestion method since you will most likely never be able to know when an issue happens on Kafka.
These methods require the deployment of an additional Technology addon: https://splunkbase.splunk.com/app/4193
These methods are heavily described here: https://da-itsi-telegraf-os.readthedocs.io/en/latest/telegraf.html
Telegraf installation and configuration
Telegraf installation, configuration and start
If you are running Telegraf as a regular process in machine, the standard installation of Telegraf is really straightforward, consult:
If you have a Splunk Universal Forwarder deployment, you can deploy, run and maintain Telegraf and its configuration through a Splunk application (TA), consult:
An example of a ready to use TA application can be found here:
For Splunk customers, this solution has various advantages as you can deploy and maintain using your existing Splunk infrastructure.
Telegraf is extremely container friendly, a container approach is very convenient as you can easily run multiple Telegraf containers to monitor each of the Kafka infrastructure components:
Data collection environment design:
The most scalalable and highly available design in term of where placing the Telegraf instances is to deploy Telegraf locally on each server to be monitored (and collect locally the component) or running as a side car container for Kubernetes based environments.
It is to possible to collect multiple instances of multiple components via a unique Telegraf instance, however there will be a limit where issues can start, and this design will not provide high availability as the failure of this instance will impact the whole metric collection.
Telegraf output configuration
Whether you will be running Telegraf in various containers, or installed as a regular software within the different servers composing your Kafka infrastructure, a minimal configuration is required to teach Telegraf how to forward the metrics to your Splunk deployment.
Telegraf is able to send to data to Splunk in different ways:
- Splunk HTTP Events Collector (HEC) - Since Telegraf v1.8
- Splunk TCP inputs in Graphite format with tags support and the TA for Telegraf
- Apache Kafka topic in Graphite format with tags support and the TA for Telegraf and Splunk connect for Kafka
Who watches for the watcher?
As you are running a Kafka deployment, it would seem very logical to produce metrics in a Kafka topic. However, it presents a specific concern for Kafka itself.
If you use this same system for monitoring Kafka itself, it is very likely that you will never know when Kafka is broken because the data flow for your monitoring system will be broken as well.
The recommendation is to rely either on Splunk HEC or TCP inputs to forward Telegraf metrics data for the Kafka monitoring.
A minimal configuration for telegraf.conf, running in container or as a regular process in machine and forwarding to HEC:
[global_tags]
  # the env tag is used by the application for multi-environments management
  env = "my_env"
  # the label tag is an optional tag used by the application that you can use as additional label for the services or infrastructure
  label = "my_env_label"

[agent]
  interval = "10s"
  flush_interval = "10s"
  hostname = "$HOSTNAME"

# outputs
[[outputs.http]]
   url = "https://splunk:8088/services/collector"
   insecure_skip_verify = true
   data_format = "splunkmetric"
    ## Provides time, index, source overrides for the HEC
   splunkmetric_hec_routing = true
    ## Additional HTTP headers
    [outputs.http.headers]
   # Should be set manually to "application/json" for json data_format
      Content-Type = "application/json"
      Authorization = "Splunk 205d43f1-2a31-4e60-a8b3-327eda49944a"
      X-Splunk-Request-Channel = "205d43f1-2a31-4e60-a8b3-327eda49944a"
If for some reasons, you have to use either of the 2 other solutions, please consult:
Jolokia JVM monitoring
The following Kafka components require Jolokia to be deployed and started, as the modern and efficient interface to JMX that is collected by Telegraf:
- Apache Kafka Brokers
- Apache Kafka Connect
- Confluent schema-registry
- Confluent ksql-server
- Confluent kafka-rest
For the complete documentation of Jolokia, see:
Jolokia JVM agent can be started in 2 ways, either as using the -javaagent argument during the start of the JVM, or on the fly by attaching Jolokia to the PID ot the JVM:
Starting Jolokia with the JVM
To start Jolokia agent using the -javaagent argument, use such option at the start of the JVM:
-javaagent:/opt/jolokia/jolokia.jar=port=8778,host=0.0.0.0
Note: This method is the method used in the docker example within this documentation by using the environment variables of the container.
When running on dedicated servers or virtual machines, update the relevant systemd configuration file to start Jolokia automatically:
For Kafka brokers
For bare-metals and dedicated VMs:
- Edit:
/lib/systemd/system/confluent-kafka.service - Add
-javaagentargument:
[Unit]
Description=Apache Kafka - broker
Documentation=http://docs.confluent.io/
After=network.target confluent-zookeeper.target

[Service]
Type=simple
User=cp-kafka
Group=confluent
ExecStart=/usr/bin/kafka-server-start /etc/kafka/server.properties
Environment="KAFKA_OPTS=-javaagent:/opt/jolokia/jolokia.jar=port=8778,host=0.0.0.0"
TimeoutStopSec=180
Restart=no

[Install]
WantedBy=multi-user.target
- Reload systemd and restart:
sudo systemctl daemon-restart
sudo systemctl restart confluent-kafka
For container based environments:
Define the following environment variable when starting the containers:
KAFKA_OPTS: "-javaagent:/opt/jolokia/jolokia.jar=port=8778,host=0.0.0.0"
For Kafka Connect
For bare-metals and dedicated VMs:
- Edit:
/lib/systemd/system/confluent-kafka-connect.service - Add
-javaagentargument:
[Unit]
Description=Apache Kafka Connect - distributed
Documentation=http://docs.confluent.io/
After=network.target confluent-kafka.target

[Service]
Type=simple
User=cp-kafka-connect
Group=confluent
ExecStart=/usr/bin/connect-distributed /etc/kafka/connect-distributed.properties
Environment="KAFKA_OPTS=-javaagent:/opt/jolokia/jolokia.jar=port=8778,host=0.0.0.0"
Environment="LOG_DIR=/var/log/connect"
TimeoutStopSec=180
Restart=no

[Install]
WantedBy=multi-user.target
- Reload systemd and restart:
sudo systemctl daemon-restart
sudo systemctl restart confluent-kafka-connect
For container based environments:
Define the following environment variable when starting the containers:
KAFKA_OPTS: "-javaagent:/opt/jolokia/jolokia.jar=port=8778,host=0.0.0.0"
For Confluent schema-registry
For bare-metals and dedicated VMs:
- Edit:
/lib/systemd/system/confluent-schema-registry.service - Add
-javaagentargument:
[Unit]
Description=RESTful Avro schema registry for Apache Kafka
Documentation=http://docs.confluent.io/
After=network.target confluent-kafka.target

[Service]
Type=simple
User=cp-schema-registry
Group=confluent
Environment="LOG_DIR=/var/log/confluent/schema-registry"
Environment="SCHEMA_REGISTRY_OPTS=-javaagent:/opt/jolokia/jolokia.jar=port=8778,host=0.0.0.0"
ExecStart=/usr/bin/schema-registry-start /etc/schema-registry/schema-registry.properties
TimeoutStopSec=180
Restart=no

[Install]
WantedBy=multi-user.target
- Reload systemd and restart:
sudo systemctl daemon-restart
sudo systemctl restart confluent-schema-registry
For container based environments:
Define the following environment variable when starting the containers:
SCHEMA_REGISTRY_OPTS: "-javaagent:/opt/jolokia/jolokia.jar=port=8778,host=0.0.0.0"
For Confluent ksql-server
For bare-metals and dedicated VMs:
- Edit:
/lib/systemd/system/confluent-ksql.service - Add
-javaagentargument:
[Unit]
Description=Streaming SQL engine for Apache Kafka
Documentation=http://docs.confluent.io/
After=network.target confluent-kafka.target confluent-schema-registry.target

[Service]
Type=simple
User=cp-ksql
Group=confluent
Environment="LOG_DIR=/var/log/confluent/ksql"
Environment="KSQL_OPTS=-javaagent:/opt/jolokia/jolokia.jar=port=8778,host=0.0.0.0"
ExecStart=/usr/bin/ksql-server-start /etc/ksql/ksql-server.properties
TimeoutStopSec=180
Restart=no

[Install]
WantedBy=multi-user.target
- Reload systemd and restart:
sudo systemctl daemon-restart
sudo systemctl restart confluent-ksql
For container based environments:
Define the following environment variable when starting the containers:
KSQL_OPTS: "-javaagent:/opt/jolokia/jolokia.jar=port=8778,host=0.0.0.0"
For Confluent kafka-rest
For bare-metals and dedicated VMs:
- Edit:
/lib/systemd/system/confluent-kafka-rest.service - Add
-javaagentargument:
[Unit]
Description=A REST proxy for Apache Kafka
Documentation=http://docs.confluent.io/
After=network.target confluent-kafka.target

[Service]
Type=simple
User=cp-kafka-rest
Group=confluent
Environment="LOG_DIR=/var/log/confluent/kafka-rest"
Environment="KAFKAREST_OPTS=-javaagent:/opt/jolokia/jolokia.jar=port=8778,host=0.0.0.0"


ExecStart=/usr/bin/kafka-rest-start /etc/kafka-rest/kafka-rest.properties
TimeoutStopSec=180
Restart=no

[Install]
WantedBy=multi-user.target
- Reload systemd and restart:
sudo systemctl daemon-restart
sudo systemctl restart confluent-kafka-rest
For container based environments:
Define the following environment variable when starting the containers:
KAFKAREST_OPTS: "-javaagent:/opt/jolokia/jolokia.jar=port=8778,host=0.0.0.0"
Notes: “KAFKAREST_OPTS” is not a typo, this is the real name of the environment variable for some reason.
Starting Jolokia on the fly
To attach Jolokia agent to an existing JVM, identify its process ID (PID), simplistic example:
ps -ef | grep 'kafka.properties' | grep -v grep | awk '{print $1}'
Then:
java -jar /opt/jolokia/jolokia.jar --host 0.0.0.0 --port 8778 start <PID>
Add this operation to any custom init scripts you use to start the Kafka components.
Zookeeper monitoring
Collecting with Telegraf
The Zookeeper monitoring is very simple and achieved by Telegraf and the Zookeeper input plugin.
The following configuration stands in telegraf.conf and configures the input plugin to monitor multiple Zookeeper servers from one source:
# zookeeper metrics
[[inputs.zookeeper]]
  servers = ["zookeeper-1:12181","zookeeper-2:22181","zookeeper-3:32181"]
If each server runs an instance of Zookeeper and you deploy Telegraf, you can simply collect from the localhost:
# zookeeper metrics
[[inputs.zookeeper]]
  servers = ["$HOSTNAME:2181"]
Full telegraf.conf example
The following telegraf.conf collects a cluster of 3 Zookeeper servers:
[global_tags]
  # the env tag is used by the application for multi-environments management
  env = "my_env"
  # the label tag is an optional tag used by the application that you can use as additional label for the services or infrastructure
  label = "my_env_label"

[agent]
  interval = "10s"
  flush_interval = "10s"
  hostname = "$HOSTNAME"

# outputs
[[outputs.http]]
   url = "https://splunk:8088/services/collector"
   insecure_skip_verify = true
   data_format = "splunkmetric"
    ## Provides time, index, source overrides for the HEC
   splunkmetric_hec_routing = true
    ## Additional HTTP headers
    [outputs.http.headers]
   # Should be set manually to "application/json" for json data_format
      Content-Type = "application/json"
      Authorization = "Splunk 205d43f1-2a31-4e60-a8b3-327eda49944a"
      X-Splunk-Request-Channel = "205d43f1-2a31-4e60-a8b3-327eda49944a"

# zookeeper metrics
[[inputs.zookeeper]]
  servers = ["zookeeper-1:12181","zookeeper-2:22181","zookeeper-3:32181"]
Visualization of metrics within the Splunk metrics workspace application:

Using mcatalog search command to verify data availability:
| mcatalog values(metric_name) values(_dims) where index=* metric_name=zookeeper.*
Kafka brokers monitoring with Jolokia
Collecting with Telegraf
Depending on how you run Kafka and your architecture preferences, you may prefer to collect all the brokers metrics from one Telegraf collector, or installed locally on the Kafka brocker machine.
Connecting to multiple remote Jolokia instances:
# Kafka JVM monitoring
[[inputs.jolokia2_agent]]
  name_prefix = "kafka_"
  urls = ["http://kafka-1:18778/jolokia","http://kafka-2:28778/jolokia","http://kafka-3:38778/jolokia"]
Connecting to the local Jolokia instance:
# Kafka JVM monitoring
[[inputs.jolokia2_agent]]
  name_prefix = "kafka_"
  urls = ["http://$HOSTNAME:8778/jolokia"]
Full telegraf.conf example
The following telegraf.conf collects a cluster of 3 Kafka brokers:
[global_tags]
  # the env tag is used by the application for multi-environments management
  env = "my_env"
  # the label tag is an optional tag used by the application that you can use as additional label for the services or infrastructure
  label = "my_env_label"

[agent]
  interval = "10s"
  flush_interval = "10s"
  hostname = "$HOSTNAME"

# outputs
[[outputs.http]]
   url = "https://splunk:8088/services/collector"
   insecure_skip_verify = true
   data_format = "splunkmetric"
    ## Provides time, index, source overrides for the HEC
   splunkmetric_hec_routing = true
    ## Additional HTTP headers
    [outputs.http.headers]
   # Should be set manually to "application/json" for json data_format
      Content-Type = "application/json"
      Authorization = "Splunk 205d43f1-2a31-4e60-a8b3-327eda49944a"
      X-Splunk-Request-Channel = "205d43f1-2a31-4e60-a8b3-327eda49944a"

# Kafka JVM monitoring

[[inputs.jolokia2_agent]]
  name_prefix = "kafka_"
  urls = ["http://kafka-1:18778/jolokia","http://kafka-2:28778/jolokia","http://kafka-3:38778/jolokia"]

[[inputs.jolokia2_agent.metric]]
  name         = "controller"
  mbean        = "kafka.controller:name=*,type=*"
  field_prefix = "$1."

[[inputs.jolokia2_agent.metric]]
  name         = "replica_manager"
  mbean        = "kafka.server:name=*,type=ReplicaManager"
  field_prefix = "$1."

[[inputs.jolokia2_agent.metric]]
  name         = "purgatory"
  mbean        = "kafka.server:delayedOperation=*,name=*,type=DelayedOperationPurgatory"
  field_prefix = "$1."
  field_name   = "$2"

[[inputs.jolokia2_agent.metric]]
  name     = "client"
  mbean    = "kafka.server:client-id=*,type=*"
  tag_keys = ["client-id", "type"]

[[inputs.jolokia2_agent.metric]]
  name         = "network"
  mbean        = "kafka.network:name=*,request=*,type=RequestMetrics"
  field_prefix = "$1."
  tag_keys     = ["request"]

[[inputs.jolokia2_agent.metric]]
  name         = "network"
  mbean        = "kafka.network:name=ResponseQueueSize,type=RequestChannel"
  field_prefix = "ResponseQueueSize"
  tag_keys     = ["name"]

[[inputs.jolokia2_agent.metric]]
  name         = "network"
  mbean        = "kafka.network:name=NetworkProcessorAvgIdlePercent,type=SocketServer"
  field_prefix = "NetworkProcessorAvgIdlePercent"
  tag_keys     = ["name"]

[[inputs.jolokia2_agent.metric]]
  name         = "topics"
  mbean        = "kafka.server:name=*,type=BrokerTopicMetrics"
  field_prefix = "$1."

[[inputs.jolokia2_agent.metric]]
  name         = "topic"
  mbean        = "kafka.server:name=*,topic=*,type=BrokerTopicMetrics"
  field_prefix = "$1."
  tag_keys     = ["topic"]

[[inputs.jolokia2_agent.metric]]
  name       = "partition"
  mbean      = "kafka.log:name=*,partition=*,topic=*,type=Log"
  field_name = "$1"
  tag_keys   = ["topic", "partition"]

[[inputs.jolokia2_agent.metric]]
  name       = "log"
  mbean      = "kafka.log:name=LogFlushRateAndTimeMs,type=LogFlushStats"
  field_name = "LogFlushRateAndTimeMs"
  tag_keys   = ["name"]

[[inputs.jolokia2_agent.metric]]
  name       = "partition"
  mbean      = "kafka.cluster:name=UnderReplicated,partition=*,topic=*,type=Partition"
  field_name = "UnderReplicatedPartitions"
  tag_keys   = ["topic", "partition"]

[[inputs.jolokia2_agent.metric]]
  name     = "request_handlers"
  mbean    = "kafka.server:name=RequestHandlerAvgIdlePercent,type=KafkaRequestHandlerPool"
  tag_keys = ["name"]

# JVM garbage collector monitoring
[[inputs.jolokia2_agent.metric]]
  name     = "jvm_garbage_collector"
  mbean    = "java.lang:name=*,type=GarbageCollector"
  paths    = ["CollectionTime", "CollectionCount", "LastGcInfo"]
  tag_keys = ["name"]
Visualization of metrics within the Splunk metrics workspace application:

Using mcatalog search command to verify data availability:
| mcatalog values(metric_name) values(_dims) where index=* metric_name=kafka_*.*
Kafka connect monitoring
Collecting with Telegraf
Connecting to multiple remote Jolokia instances:
# Kafka-connect JVM monitoring
[[inputs.jolokia2_agent]]
  name_prefix = "kafka_connect."
  urls = ["http://kafka-connect-1:18779/jolokia","http://kafka-connect-2:28779/jolokia","http://kafka-connect-3:38779/jolokia"]
Connecting to local Jolokia instance:
# Kafka-connect JVM monitoring
 [[inputs.jolokia2_agent]]
   name_prefix = "kafka_connect."
   urls = ["http://$HOSTNAME:8778/jolokia"]
Full telegraf.conf example
bellow a full telegraf.conf example:
[global_tags]
  # the env tag is used by the application for multi-environments management
  env = "my_env"
  # the label tag is an optional tag used by the application that you can use as additional label for the services or infrastructure
  label = "my_env_label"

[agent]
  interval = "10s"
  flush_interval = "10s"
  hostname = "$HOSTNAME"

# outputs
[[outputs.http]]
   url = "https://splunk:8088/services/collector"
   insecure_skip_verify = true
   data_format = "splunkmetric"
    ## Provides time, index, source overrides for the HEC
   splunkmetric_hec_routing = true
    ## Additional HTTP headers
    [outputs.http.headers]
   # Should be set manually to "application/json" for json data_format
      Content-Type = "application/json"
      Authorization = "Splunk 205d43f1-2a31-4e60-a8b3-327eda49944a"
      X-Splunk-Request-Channel = "205d43f1-2a31-4e60-a8b3-327eda49944a"

# Kafka-connect JVM monitoring

[[inputs.jolokia2_agent]]
  name_prefix = "kafka_connect."
  urls = ["http://kafka-connect-1:18779/jolokia","http://kafka-connect-2:28779/jolokia","http://kafka-connect-3:38779/jolokia"]

[[inputs.jolokia2_agent.metric]]
  name         = "worker"
  mbean        = "kafka.connect:type=connect-worker-metrics"

[[inputs.jolokia2_agent.metric]]
  name         = "worker"
  mbean        = "kafka.connect:type=connect-worker-rebalance-metrics"

[[inputs.jolokia2_agent.metric]]
  name         = "connector-task"
  mbean        = "kafka.connect:type=connector-task-metrics,connector=*,task=*"
  tag_keys = ["connector", "task"]

[[inputs.jolokia2_agent.metric]]
  name         = "sink-task"
  mbean        = "kafka.connect:type=sink-task-metrics,connector=*,task=*"
  tag_keys = ["connector", "task"]

[[inputs.jolokia2_agent.metric]]
  name         = "source-task"
  mbean        = "kafka.connect:type=source-task-metrics,connector=*,task=*"
  tag_keys = ["connector", "task"]

[[inputs.jolokia2_agent.metric]]
  name         = "error-task"
  mbean        = "kafka.connect:type=task-error-metrics,connector=*,task=*"
  tag_keys = ["connector", "task"]

# Kafka connect return a status value which is non numerical
# Using the enum processor with the following configuration replaces the string value by our mapping
[[processors.enum]]
  [[processors.enum.mapping]]
    ## Name of the field to map
    field = "status"

    ## Table of mappings
    [processors.enum.mapping.value_mappings]
      paused = 0
      running = 1
      unassigned = 2
      failed = 3
      destroyed = 4
Visualization of metrics within the Splunk metrics workspace application:

Using mcatalog search command to verify data availability:
| mcatalog values(metric_name) values(_dims) where index=* metric_name=kafka_connect.*
Kafka LinkedIn monitor - end to end monitoring
Installing and starting the Kafka monitor
LinkedIn provides an extremely powerful open source end to end monitoring solution for Kafka, please consult:
As a builtin configuration, the kafka-monitor implements a jolokia agent, so collecting the metrics with Telegraf cannot be more easy !
It is very straightforward to run the kafka-monitor in a docker container, first you need to create your own image:
In a nutshell, you would:
git clone https://github.com/linkedin/kafka-monitor.git
cd kafka-monitor
./gradlew jar
cd docker
Edit the Makefile to match your needs
make container
make push
Then start your container, example with docker-compose:
kafka-monitor:
image: guilhemmarchand/kafka-monitor:2.0.3
hostname: kafka-monitor
volumes:
  - ../kafka-monitor:/usr/local/share/kafka-monitor
command: "/opt/kafka-monitor/bin/kafka-monitor-start.sh /usr/local/share/kafka-monitor/kafka-monitor.properties"
Once your Kafka monitor is running, you need a Telegraf instance that will be collecting the JMX beans, example:
[global_tags]
  # the env tag is used by the application for multi-environments management
  env = "my_env"
  # the label tag is an optional tag used by the application that you can use as additional label for the services or infrastructure
  label = "my_env_label"

[agent]
  interval = "10s"
  flush_interval = "10s"
  hostname = "$HOSTNAME"

# outputs
[[outputs.http]]
   url = "https://splunk:8088/services/collector"
   insecure_skip_verify = true
   data_format = "splunkmetric"
    ## Provides time, index, source overrides for the HEC
   splunkmetric_hec_routing = true
    ## Additional HTTP headers
    [outputs.http.headers]
   # Should be set manually to "application/json" for json data_format
      Content-Type = "application/json"
      Authorization = "Splunk 205d43f1-2a31-4e60-a8b3-327eda49944a"
      X-Splunk-Request-Channel = "205d43f1-2a31-4e60-a8b3-327eda49944a"

# Kafka JVM monitoring

[[inputs.jolokia2_agent]]
  name_prefix = "kafka_"
  urls = ["http://kafka-monitor:8778/jolokia"]

[[inputs.jolokia2_agent.metric]]
  name         = "kafka-monitor"
  mbean        = "kmf.services:name=*,type=*"
Visualization of metrics within the Splunk metrics workspace application:
Using mcatalog search command to verify data availability:
| mcatalog values(metric_name) values(_dims) where index=* metric_name=kafka_kafka-monitor.*
Confluent schema-registry
Collecting with Telegraf
Connecting to multiple remote Jolokia instances:
[[inputs.jolokia2_agent]]
  name_prefix = "kafka_schema-registry."
  urls = ["http://schema-registry:18783/jolokia"]
Connecting to local Jolokia instance:
# Kafka-connect JVM monitoring
 [[inputs.jolokia2_agent]]
  name_prefix = "kafka_schema-registry."
   urls = ["http://$HOSTNAME:8778/jolokia"]
Full telegraf.conf example
bellow a full telegraf.conf example:
[global_tags]
  # the env tag is used by the application for multi-environments management
  env = "my_env"
  # the label tag is an optional tag used by the application that you can use as additional label for the services or infrastructure
  label = "my_env_label"

[agent]
  interval = "10s"
  flush_interval = "10s"
  hostname = "$HOSTNAME"

# outputs
[[outputs.http]]
   url = "https://splunk:8088/services/collector"
   insecure_skip_verify = true
   data_format = "splunkmetric"
    ## Provides time, index, source overrides for the HEC
   splunkmetric_hec_routing = true
    ## Additional HTTP headers
    [outputs.http.headers]
   # Should be set manually to "application/json" for json data_format
      Content-Type = "application/json"
      Authorization = "Splunk 205d43f1-2a31-4e60-a8b3-327eda49944a"
      X-Splunk-Request-Channel = "205d43f1-2a31-4e60-a8b3-327eda49944a"

# schema-registry JVM monitoring

[[inputs.jolokia2_agent]]
  name_prefix = "kafka_schema-registry."
  urls = ["http://schema-registry:18783/jolokia"]

[[inputs.jolokia2_agent.metric]]
  name         = "jetty-metrics"
  mbean        = "kafka.schema.registry:type=jetty-metrics"
  paths = ["connections-active", "connections-opened-rate", "connections-closed-rate"]

[[inputs.jolokia2_agent.metric]]
  name         = "master-slave-role"
  mbean        = "kafka.schema.registry:type=master-slave-role"

[[inputs.jolokia2_agent.metric]]
  name         = "jersey-metrics"
  mbean        = "kafka.schema.registry:type=jersey-metrics"
Visualization of metrics within the Splunk metrics workspace application:

Using mcatalog search command to verify data availability:
| mcatalog values(metric_name) values(_dims) where index=* metric_name=kafka_schema-registry.*
Confluent ksql-server
Collecting with Telegraf
Connecting to multiple remote Jolokia instances:
[[inputs.jolokia2_agent]]
  name_prefix = "kafka_"
  urls = ["http://ksql-server-1:18784/jolokia"]
Connecting to local Jolokia instance:
[[inputs.jolokia2_agent]]
  name_prefix = "kafka_"
  urls = ["http://$HOSTNAME:18784/jolokia"]
Full telegraf.conf example
bellow a full telegraf.conf example:
[global_tags]
  # the env tag is used by the application for multi-environments management
  env = "my_env"
  # the label tag is an optional tag used by the application that you can use as additional label for the services or infrastructure
  label = "my_env_label"

[agent]
  interval = "10s"
  flush_interval = "10s"
  hostname = "$HOSTNAME"

# outputs
[[outputs.http]]
   url = "https://splunk:8088/services/collector"
   insecure_skip_verify = true
   data_format = "splunkmetric"
    ## Provides time, index, source overrides for the HEC
   splunkmetric_hec_routing = true
    ## Additional HTTP headers
    [outputs.http.headers]
   # Should be set manually to "application/json" for json data_format
      Content-Type = "application/json"
      Authorization = "Splunk 205d43f1-2a31-4e60-a8b3-327eda49944a"
      X-Splunk-Request-Channel = "205d43f1-2a31-4e60-a8b3-327eda49944a"

# ksql-server JVM monitoring

 [[inputs.jolokia2_agent]]
   name_prefix = "kafka_"
   urls = ["http://ksql-server:18784/jolokia"]

 [[inputs.jolokia2_agent.metric]]
   name         = "ksql-server"
   mbean        = "io.confluent.ksql.metrics:type=*"
Visualization of metrics within the Splunk metrics workspace application:

Using mcatalog search command to verify data availability:
| mcatalog values(metric_name) values(_dims) where index=* metric_name=kafka_ksql-server.*
Confluent kafka-rest
Collecting with Telegraf
Connecting to multiple remote Jolokia instances:
[[inputs.jolokia2_agent]]
  name_prefix = "kafka_kafka-rest."
  urls = ["http://kafka-rest:8778/jolokia"]
Connecting to local Jolokia instance:
[[inputs.jolokia2_agent]]
  name_prefix = "kafka_kafka-rest."
  urls = ["http://$HOSTNAME:18785/jolokia"]
Full telegraf.conf example
bellow a full telegraf.conf example:
[global_tags]
  # the env tag is used by the application for multi-environments management
  env = "my_env"
  # the label tag is an optional tag used by the application that you can use as additional label for the services or infrastructure
  label = "my_env_label"

[agent]
  interval = "10s"
  flush_interval = "10s"
  hostname = "$HOSTNAME"

# outputs
[[outputs.http]]
   url = "https://splunk:8088/services/collector"
   insecure_skip_verify = true
   data_format = "splunkmetric"
    ## Provides time, index, source overrides for the HEC
   splunkmetric_hec_routing = true
    ## Additional HTTP headers
    [outputs.http.headers]
   # Should be set manually to "application/json" for json data_format
      Content-Type = "application/json"
      Authorization = "Splunk 205d43f1-2a31-4e60-a8b3-327eda49944a"
      X-Splunk-Request-Channel = "205d43f1-2a31-4e60-a8b3-327eda49944a"

 # kafka-rest JVM monitoring

 [[inputs.jolokia2_agent]]
   name_prefix = "kafka_kafka-rest."
   urls = ["http://kafka-rest:18785/jolokia"]

 [[inputs.jolokia2_agent.metric]]
   name         = "jetty-metrics"
   mbean        = "kafka.rest:type=jetty-metrics"
   paths = ["connections-active", "connections-opened-rate", "connections-closed-rate"]

 [[inputs.jolokia2_agent.metric]]
   name         = "jersey-metrics"
   mbean        = "kafka.rest:type=jersey-metrics"
Visualization of metrics within the Splunk metrics workspace application:

Using mcatalog search command to verify data availability:
| mcatalog values(metric_name) values(_dims) where index=* metric_name=kafka_kafka_kafka-rest.*
Burrow Lag Consumers
As from their authors, Burrow is a monitoring companion for Apache Kafka that provides consumer lag checking as a service without the need for specifying thresholds.
See: https://github.com/linkedin/Burrow
Burrow workflow diagram:

Burrow is a very powerful application that monitors all consumers (Kafka Connect connectors, Kafka Streams…) to report an advanced state of the service automatically, and various useful lagging metrics.
Telegraf has a native input for Burrow which polls consumers, topics and partitions lag metrics and statuses over http, use the following telegraf minimal configuration:
See: https://github.com/influxdata/telegraf/tree/master/plugins/inputs/burrow
[global_tags]
  # the env tag is used by the application for multi-environments management
  env = "my_env"
  # the label tag is an optional tag used by the application that you can use as additional label for the services or infrastructure
  label = "my_env_label"

[agent]
  interval = "10s"
  flush_interval = "10s"
  hostname = "$HOSTNAME"

# outputs
[[outputs.http]]
   url = "https://splunk:8088/services/collector"
   insecure_skip_verify = true
   data_format = "splunkmetric"
    ## Provides time, index, source overrides for the HEC
   splunkmetric_hec_routing = true
    ## Additional HTTP headers
    [outputs.http.headers]
   # Should be set manually to "application/json" for json data_format
      Content-Type = "application/json"
      Authorization = "Splunk 205d43f1-2a31-4e60-a8b3-327eda49944a"
      X-Splunk-Request-Channel = "205d43f1-2a31-4e60-a8b3-327eda49944a"

# Burrow

[[inputs.burrow]]
  ## Burrow API endpoints in format "schema://host:port".
  ## Default is "http://localhost:8000".
  servers = ["http://dockerhost:9001"]

  ## Override Burrow API prefix.
  ## Useful when Burrow is behind reverse-proxy.
  # api_prefix = "/v3/kafka"

  ## Maximum time to receive response.
  # response_timeout = "5s"

  ## Limit per-server concurrent connections.
  ## Useful in case of large number of topics or consumer groups.
  # concurrent_connections = 20

  ## Filter clusters, default is no filtering.
  ## Values can be specified as glob patterns.
  # clusters_include = []
  # clusters_exclude = []

  ## Filter consumer groups, default is no filtering.
  ## Values can be specified as glob patterns.
  # groups_include = []
  # groups_exclude = []

  ## Filter topics, default is no filtering.
  ## Values can be specified as glob patterns.
  # topics_include = []
  # topics_exclude = []

  ## Credentials for basic HTTP authentication.
  # username = ""
  # password = ""

  ## Optional SSL config
  # ssl_ca = "/etc/telegraf/ca.pem"
  # ssl_cert = "/etc/telegraf/cert.pem"
  # ssl_key = "/etc/telegraf/key.pem"
  # insecure_skip_verify = false
Visualization of metrics within the Splunk metrics workspace application:

Using mcatalog search command to verify data availability:
| mcatalog values(metric_name) values(_dims) where index=* metric_name=burrow_*
Operating System level metrics
Monitoring the Operating System level metrics is fully part of the monitoring requirements of a Kafka infrastructure.
Bare metal servers and virtual machines
ITSI module for Telegraf Operating System
Telegraf has very powerful Operating System level metrics capabilities, checkout the ITSI module for Telegraf Operating System monitoring !
https://da-itsi-telegraf-os.readthedocs.io

ITSI module for metricator Nmon
Another very powerful way of monitoring Operating System level metrics with a builtin ITSI module and the excellent nmon monitoring:
https://www.octamis.com/metricator-docs/itsi_module.html

ITSI module for OS
Last option is using the builtin ITSI module for OS which relies on the TA-nix or TA-Windows:
http://docs.splunk.com/Documentation/ITSI/latest/IModules/AbouttheOperatingSystemModule
Containers with Docker and container orchestrators
Telegraf docker monitoring
Telegraf has very powerful inputs for Docker and is natively compatible with a container orchestrator such as Kubernetes.
Specially with Kubernetes, it is very easy to run a Telegraf container as a daemonset in Kubernetes and retrieve all the performance metrics of the containers.